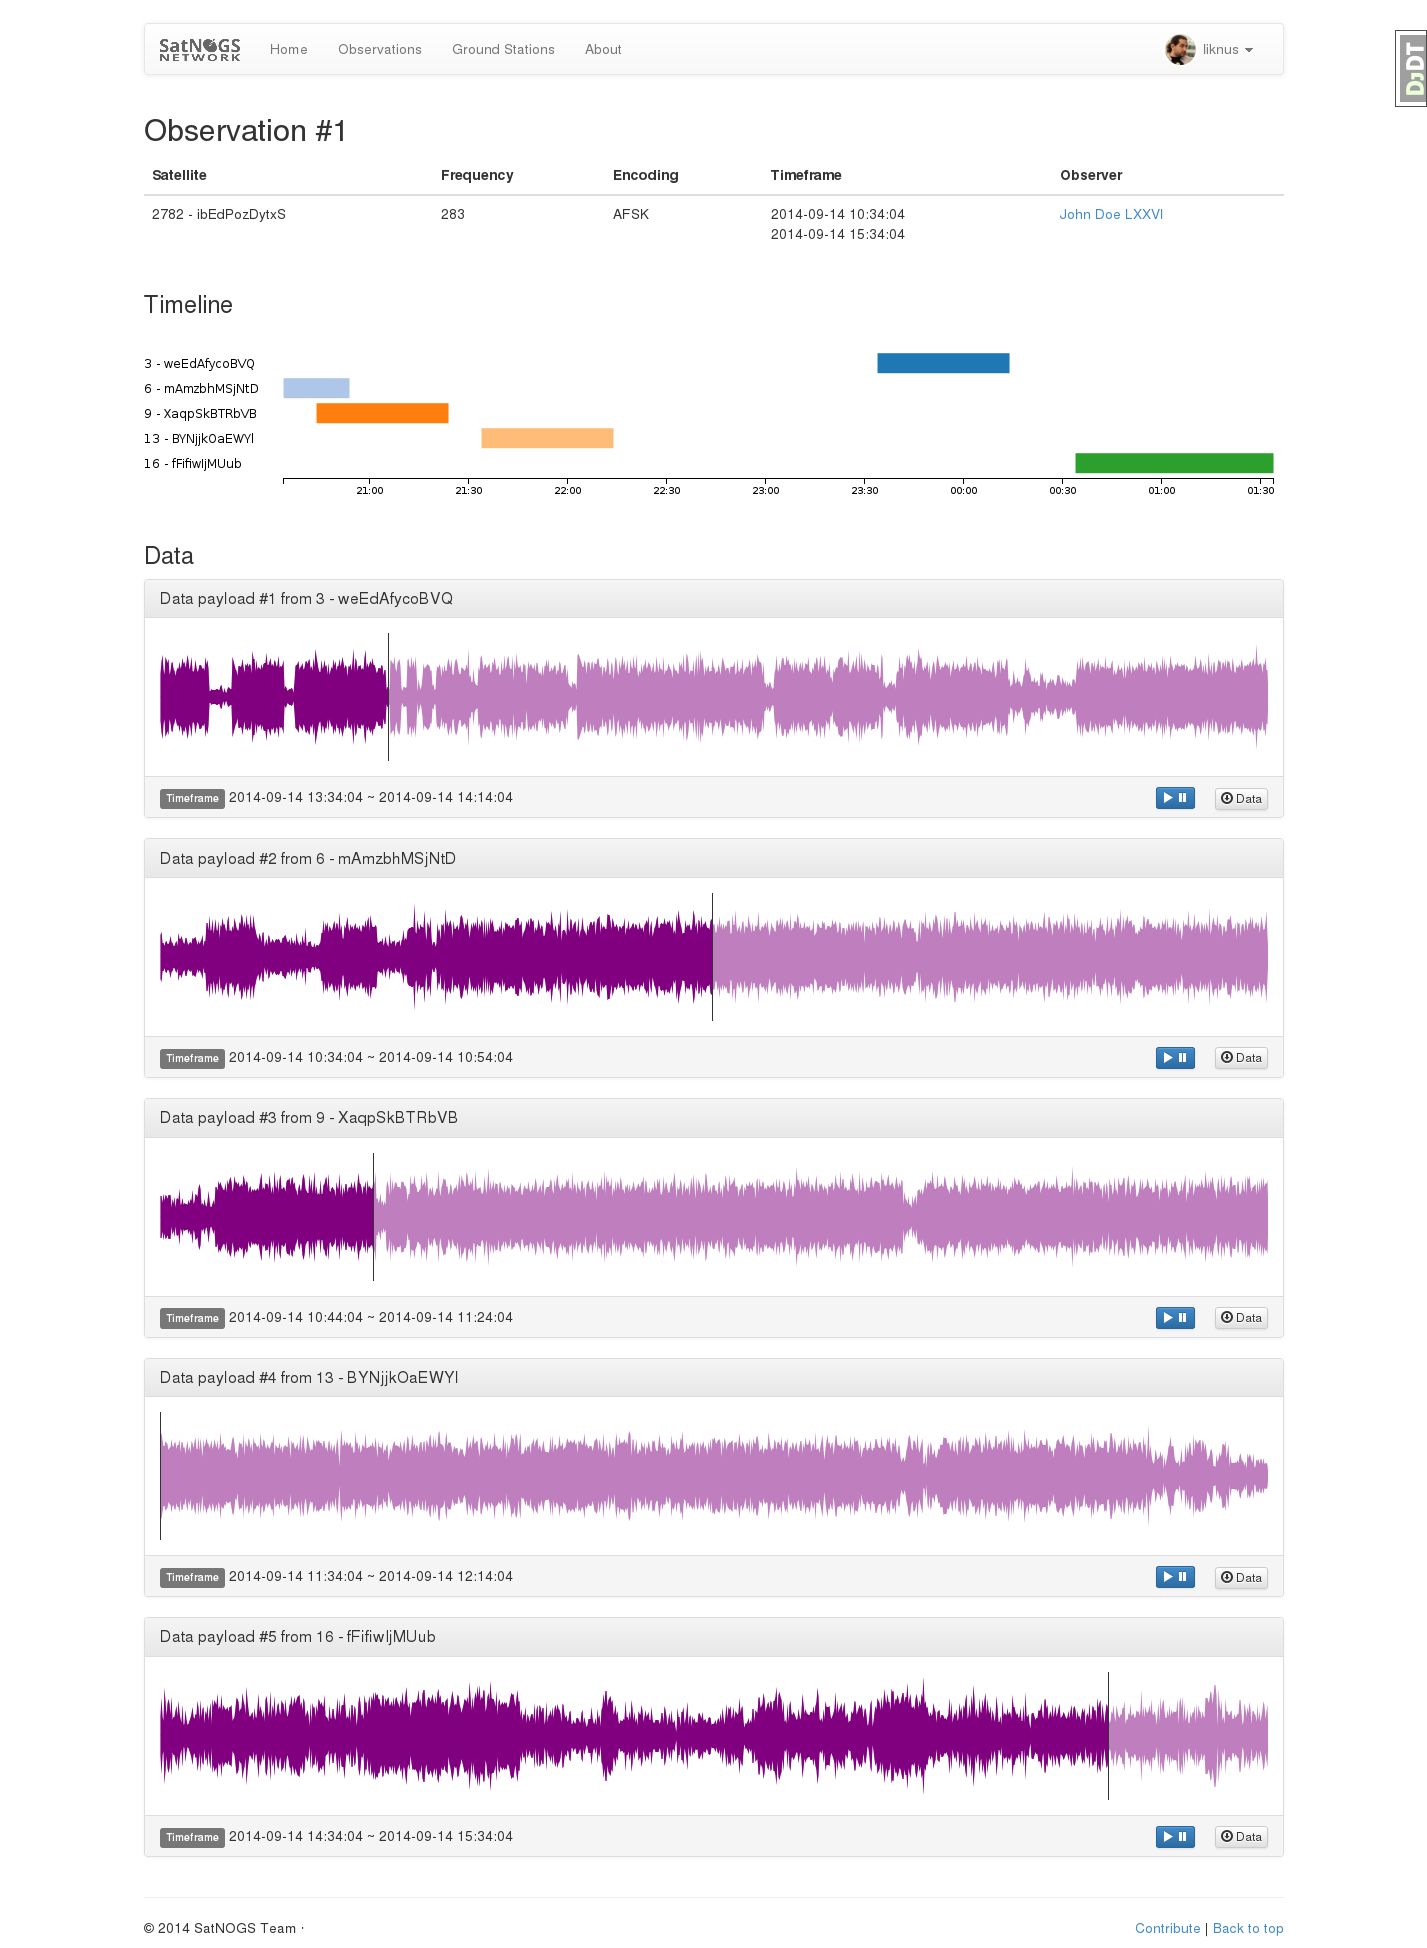
Continuing the development of SatNOGS Network, we focused on enhancing the observation results page. Check out how it looks overall:
What is new?
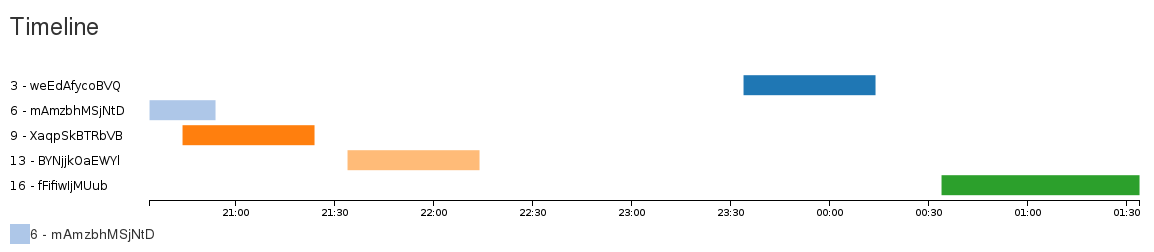
Timeline
The new timeline view gives a quick overview on the data that each ground station collected within the observation timeframe. On the left you can see the list of the Ground Stations that participated in the observation and on the right you can check the timeblocks each ground station got data. We used the nice d3-timeline js plugin for it.
Data View
Each data that is associated with an observation is displayed in a new panel-based section. The data we collect can be either text (decoded messages) or sound (available for further processing). We dealt with the hardest one first. We used Wavesurfer.js to visualize the waveform (HTML5, WebAudio and Canvas FTW!) and added the ability for playback directly in the browser. A download link is also available.

The code for the implementation of the new views is already pushed in our repos. Soon we will be updating the dev instance with mock data so that you can check out the new functionality yourself.


